Business Dynamics Statistics of Human Capital (BDS-HC)

Business Dynamics Statistics of Human Capital (BDS-HC)
The Business Dynamics Statistics of Human Capital (BDS-HC) is an experimental data product that extends the set of statistics published by the Business Dynamics Statistics program. These are the first public-use statistics that use W-2 filings to combine longitudinal business data with population-level worker demographic data to classify firms based on the characteristics of their workers.
The BDS-HC tables describe the relationship between business dynamics and workforce composition for nearly all non-farm employer businesses in the United States from 2006 to 2022. Each table reports all economic outcomes covered by the BDS, including establishment openings and closings, firm startups and shutdowns, and job creation and destruction, for different groups of firms based on their workforce composition. Separate tables are available based on the share of a firm’s workforce that belongs to each category within six demographic characteristics: age, sex, race, ethnicity, nativity, and education. Tables also provide statistics broken out by the interaction between workforce composition and business characteristics, such as the establishment’s industrial sector and state and the firm’s size and age.
Jump to:
These new tables enable users to study trends in employment across firms that have different propensities to hire various groups of workers. They also provide details about the economic environments faced by different groups of workers due to their employers, including differences in the overall job creation, job destruction, entry, or exit of their employers. As an example of the information in these tables, we summarize some patterns based on the firm workforce composition of workers over age 55. Additional findings, including those for other workforce characteristics, and methodological details for all calculations can be found in the working paper Stinson and Wang (2025).
Figure 1 shows that the typical workplace has become much older between 2006 and 2022. Total employment at firms with less than 10% of their workers over age 55 started at a high of 45.3 million in 2006 and steadily dropped in subsequent years. Most of this decline occurred over 2006-2011, a period when employment losses around the Great Recession coincided with the aging of Baby Boomers into the “over age 55” group. Meanwhile, total employment at firms with at least 25% of their workers over age 55 started at a low of 12.8 million in 2006 and grew steadily over time until 2021, when it reached a high of 35.5 million. By 2022, a greater share of workers was employed at firms where at least 25% of workers were over age 55 than at firms where less than 10% of workers were over age 55.
Figure 1. Annual employment by firm workforce share over age 55
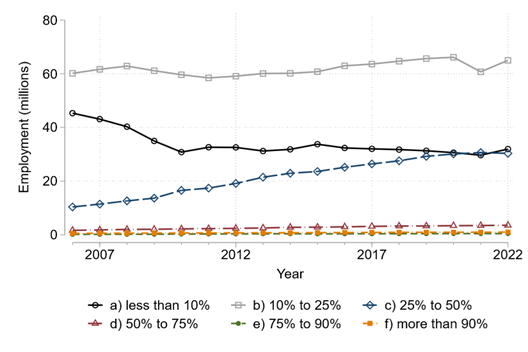
Figure Notes: This figure plots the total tabulated employment in each year based on the share of each firm's workforce that belongs to the “over age 55” category. Source: BDS-HC tables (2022 vintage), Initial Firm Workforce Share Over Age 55 by Initial Firm Size Coarse (bds2022_ifzc_ica_55.csv). Data Management System (DMS) number: P-7508149, Disclosure Review Board (DRB) approval number: CBDRB-FY25-0043.
Since we calculate the composition of firm workforces separately by year, the patterns we observe in Figure 1 may be driven either by within-firm changes to the composition of their workforces, or the reallocation of employment across firms. One major advantage of integrating our workforce composition measures into the Business Dynamics Statistics infrastructure is that the establishments are linked over time, so we can directly assess the relative contribution of each of these mechanisms.
Figure 2 reports the counterfactual path of employment for each workforce composition measure under the scenario that firm workforce compositions are fixed over time. To construct this counterfactual, we first take the total employment in each firm workforce composition group as calculated in 2006. For each year after 2006, we then apply the year-over-year net job creation rate to the previous year's counterfactual employment total. This approach captures changes in employment due to job creation or job destruction from continuing establishments as well as from entry and exit but excludes any changes in employment due to continuing employers leaving a given firm workforce characteristic group (i.e., due to changes in the composition of their workforce). Absent changes in the firm workforce composition at continuing firms, employment would have shifted from firms with a higher share of older workers to firms with less than 10% of workers over age 55. By 2022, this group would have become the dominant group of firms that, together, would have accounted for 84.2 million in total employment, rather than the 31.9 million in total employment that we observe in 2022.
Figure 2. Counterfactual employment by firm workforce share over age 55 (no changes in firm workforce composition)
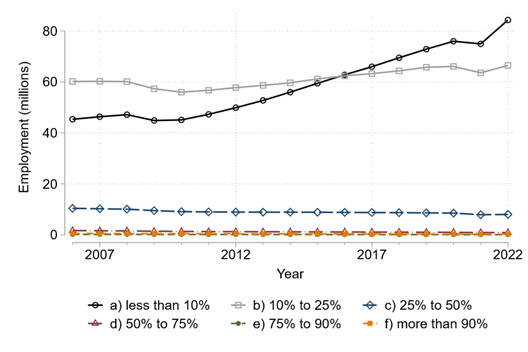
Figure Notes: This figure plots the total counterfactual employment in each year based on the share of each firm's workforce that belongs to the “over age 55” category, under the assumption that firms' workforce compositions are fixed and do not change over time. Any changes in employment in this figure are only due to job creation, job destruction, or the entry and exit of employers. Any changes due to existing employers changing the composition of their workforces are excluded. Source: BDS-HC tables (2022 vintage), Initial Firm Workforce Share Over Age 55 by Initial Firm Size Coarse (bds2022_ifzc_ica_55.csv). Data Management System (DMS) number: P-7508149, Disclosure Review Board (DRB) approval number: CBDRB-FY25-0043.
The diverging trends in Figure 2 also suggest that firms with different workforce compositions may experience systematically different business dynamics. We directly study this in Figure 3 by tabulating the overall rates of net job creation, job creation due to births, and job destruction due to exits for medium and large firms based on the share of their firm’s workforce over age 55. To account for potential differences in the firm size distribution of firms in each group, we reweight firms so that all groups have the same firm size distribution as the overall economy. We also only include firm size categories with at least 20 employees (where the workforce composition and business dynamics rates are both likely to be more stable).
We find that the average net job creation rate for firms decreases as the firm’s workforce share over age 55 increases. Firms with less than 10% of their workforce over age 55 grew at an average rate of 1.9% per year between 2006 and 2022, whereas firms with 25-50% of their workforce over age 55 contracted at an average rate of -1.9% per year over the same period. The creation of new establishments seems to be a key factor—firms in the 0-10% group create jobs through the birth of new establishments at an average rate of 15.0% per year, whereas firms in the 25-50% group create jobs through births at an average rate of 9.6% per year. Meanwhile, both groups of firms destroy jobs through establishment deaths at a similar rate—an average of 3.4% vs 3.2% per year, respectively. As a result, differences in establishment churn, particularly differences in the birth of new establishments, can more than account for the entire observed 3.9 percentage point gap in net job creation rates between these two groups.
Figure 3. Business dynamism at medium and large firms by firm workforce share over age 55, 2006-2022
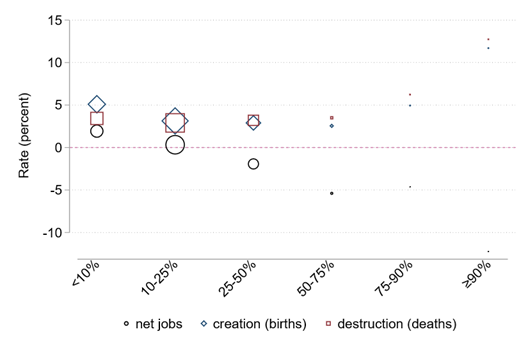
Figure Notes: This figure plots the average net job creation rate, job creation rate from births, and job destruction rate from deaths over 2006-2022 based on the share of each firm's workforce that belongs to the “over age 55” category. The size of each point reflects the magnitude of the denominator for each group, which is the average employment of establishments in the group between the current and prior year (denom). Each rate is calculated from firm-size-specific means in the workforce characteristic by firm size tables (excluding firms in the smallest “1-19” firm size category) and reweighted to reflect the firm size distribution of the overall economy. Source: BDS-HC tables (2022 vintage), Initial Firm Workforce Share Over Age 55 by Initial Firm Size Coarse (bds2022_ifzc_ica_55.csv). Data Management System (DMS) number: P-7508149, Disclosure Review Board (DRB) approval number: CBDRB-FY25-0043.
It is important to note that these tables are not designed to provide a causal analysis of either how firms match with workers or how firm outcomes are determined. Instead, they are most useful for systematically describing the patterns of sorting between workers and firms in the labor market and the resulting differences in economic environments faced by different groups of workers. We hope these tables and their underlying data will be a useful starting point for future work to understand the economic and non-economic mechanisms behind these patterns, as well as their implications for both workers and firms.
Download experimental Business Dynamics Statistics of Human Capital (BDS-HC) data tables below. Variable definitions can be found in the BDS-HC Definitions dropdown below.
Data Sources
The BDS-Human Capital tables is an experimental product of the U.S. Census Bureau developed by the Center for Economic Studies (CES). The BDS-HC data are compiled from the Longitudinal Business Database (LBD), worker W-2 tax records from the IRS, and demographics data compiled by the LEHD program from the SSA Numident, the Decennial Census, and the American Community Surveys. We use this data to classify firms by the age, sex, race, ethnicity, nativity, and educational composition of their workforce in each year. For a description of how firms are classified, please see the BDS-HC Methodology dropdown below.
The Census Bureau has reviewed this data product to ensure appropriate access, use, and disclosure avoidance protection of the confidential source data used to produce this product (Data Management System (DMS) number: P-7508149, Disclosure Review Board (DRB) approval number: CBDRB-FY25-0043).
Initial Firm Workforce Composition by Initial Firm Size Datasets

Average Firm Workforce Composition by Average Firm Size Datasets
Initial Firm Workforce Composition by Firm Age Coarse by Initial Firm Size Datasets
Initial Firm Workforce Composition by State by Initial Firm Size Datasets
Initial Firm Workforce Composition by Sector by Initial Firm Size Datasets
For the values and definitions of all workforce composition variables in the BDS-HC tables, refer to the BDS-HC Codebook.
For all other variable definitions, refer to the BDS Codebook and Glossary.
For a complete description of how the BDS data measures the stock and flow of establishments, firms, and employment, see the main BDS Methodology page.
The BDS-HC experimental data use W-2 filings to combine longitudinal business data with population-level worker demographic data to classify firms based on the characteristics of their workers. By using W-2 filings, we ensure that the universe of firms in the worker-firm data is based upon federal tax data, which also corresponds to the universe of firms underlying all the core and experimental Business Dynamics Statistics (BDS) tables. Furthermore, these W-2 records allow us to define the universe of workers at a firm in a given year as the set of all individuals who received positive W-2 wages, which we link to population-level demographics data at the Census Bureau that are compiled by the LEHD program from administrative Social Security Number (SSN) applications, Decennial Censuses, and American Community Surveys.1 As a result, we can assign demographic characteristics to firms that, together, constitute 98% of total employment tracked by the BDS over our sample period.
To classify firms by their workforce composition, we apply a single methodology to each of the six demographic characteristics that we consider: age, sex, race, ethnicity, nativity, and education. In order to tabulate different demographic characteristics in a comparable manner, we use a classification strategy that can be applied uniformly to each category within each demographic trait that we consider. As a result, our approach can be used for binary worker characteristics (sex, ethnicity, and nativity), categorical characteristics (race and education), as well as continuous characteristics (age).
The key basis for our classification approach is that we treat each category within a demographic characteristic as a distinct individual characteristic, and we separately consider the share of the firm's workforce in each year that belongs to that demographic category. Wherever possible, we use a definition for each demographic category that is consistent with the demographic categories tabulated in the Quarterly Workforce Indicators (QWI), so our firm-based statistics can be directly combined with their job-based statistics. For the workforce age composition tables, we split worker age into 7 detailed categories: 14-18, 19-24, 25-34, 35-44, 45-54, 55-64, and over 65, as well as into 3 coarse categories: 14-24, 25-54, and over 55. For the workforce racial composition tables, we separately calculate the share of the firm's workforce that belongs to each of the six racial categories available in our data: White, Black, American Indian or Alaskan Native, Asian, Native Hawaiian or Pacific Islander, and two or more races. Since the sex, ethnicity, and nativity characteristics we use are binary, we only tabulate the workforce share for one of the two categories, and the share for the other category is defined implicitly as its complement.2 Finally, the coverage of available survey data on worker educational attainment is lower for workers in more recent birth cohorts. To ensure that our educational workforce composition measures are not confounded by these changes in data coverage over time, we define the workforce educational composition as the highest degree attained by the workers born before 1976: less than high school, high school, some college, and bachelor's degree or higher.
We define the firm's workforce share for each demographic category as the share of matched workers with a valid W-2 earnings record and defined demographic characteristics who belong to that category. We calculate this share separately for each year, so the firm's workforce share can change over time either due to worker turnover or due to changes in the time-varying characteristics of incumbent workers.3 When calculating shares, we weight each worker at the firm equally. If some groups of workers are more likely to be employed on a part-time or partial-year basis, these workers would be overrepresented in the W-2 data relative to a point-in-time employment definition.4
Although the demographics data may include imputed demographic variables, we only use the non-imputed measures to calculate each firm-level share. This is equivalent to assuming that workers who are missing demographic measures have the same average composition as other workers at the firm. The appropriateness of this assumption may depend on the demographic variable in question and the type of analysis being conducted, so we also separately tabulate all tables based on the firm's workforce share that is missing each demographic trait. This allows us to directly assess the missing patterns and make alternative assumptions about their assignment process and their implications on overall employment trends.
After defining a firm's workforce share for each demographic category, we then partition these shares into six discrete groups, and we use these groups to tabulate business outcomes for our tables. The six intervals are symmetric and are based on common distributional thresholds: 0-10%, 10-25%, 25-50%, 50-75%, 75-90%, 90-100%. Consequently, it is straightforward to combine tabulated output to produce statistics based on coarser bins (e.g., by combining 50-75%, 75-90%, and 90-100% into a single 50-100% group). However, note that like in other BDS products, it is not possible to combine statistics across multiple, non-mutually exclusive firm characteristics into an aggregate category.5 So, we also tabulate tables based on an explicitly defined set of coarse age categories: 14-24, 25-54, and over 55.
All workforce composition measures are defined at the firm level, and assigned to each of their establishments. We separately tabulate business dynamics based on an establishment's initial workforce composition and its average workforce composition. The two different timing definitions are created to match the timing of the firm size measures from the core BDS. The establishment's initial firm workforce composition is defined as the establishment's firm workforce shares from the prior year. Meanwhile, the establishment's average workforce composition is defined as the average of the establishment's firm workforce share in the prior year and in the current year (weighted by total firm employment in each year).
For additional details on the input data and our matching methodology, see the accompanying working paper Stinson and Wang (2025).
Footnotes
- Although some versions of the ICF only include workers who held a UI-eligible job in one of the state-years covered by the LEHD program, we use a demographics file that includes all individuals who were ever covered by one of the component demographics files, regardless of their work status.
- We currently tabulate using the race and ethnicity definitions of the 2010 and 2020 Decennial Censuses to be consistent with the QWI.
- The ICF uses the most recent data available for each worker demographic characteristic, so the only time-varying characteristic in our case is worker age.
- Since we only observe total annual earnings in the W-2 data, we are not able to construct alternates that weight individuals by total hours or duration of employment during the year. The impact of these alternate methods is a topic for future research.
- For example, if a firm has 0-10% of workers in the 55-64 age category and 0-10% of workers in the over 65 age group, its total share of workers over age 55 can either be 0-10% or 10-25%.
Below are links to selected publications related to the BDS-Human Capital
Martha Stinson & Sean Wang, 2025. “The Composition of Firm Workforces from 2006–2022: Findings from the Business Dynamics Statistics of Human Capital Experimental Product,” Working Paper 25-20, Center for Economic Studies, U.S. Census Bureau.

Richard Beem & Christopher Goetz & Martha Stinson & Sean Wang, 2022. “Business Dynamics Statistics for Single-Unit Firms,” Working Paper 22-57, Center for Economic Studies, U.S. Census Bureau.
Questions? Contact us at [email protected].